[ad_1]
Yellowstone Caldera Chronicles is a weekly column written by scientists and collaborators of the Yellowstone Volcano Observatory. This week’s contribution is from R. Greg Vaughan, research scientist with the U.S. Geological Survey.
Thermal infrared satellite images are an important volcano monitoring tool that can be used to estimate surface temperature. And, in fact, these data are freely available for Yellowstone and many other volcanoes worldwide! But interpreting these images is not as straightforward as it might seem—what shows up as either hot or cold depends on a variety of factors.
Every object that has a temperature emits energy, or electromagnetic radiation, into its surroundings. The characteristics of this emitted radiation are primarily a function of the object’s temperature, and secondarily a function of the object’s emissivity, which is essentially a measure of how efficiently, or inefficiently, materials radiate their energy. For example, a metal roof will appear much colder in thermal infrared images than a natural rocky or soil-covered surface, even if their actual temperatures are the same.
The electromagnetic radiation given off by an object travels at the speed of light as discreet bundles of energy called photons. But it also behaves like a wave and can be described by its frequency or wavelength. Short-wavelength energy includes x-rays and gamma rays (look out, Bruce Banner!), while long-wavelength energy includes microwaves and radio waves. Electromagnetic radiation that we can see (light) has wavelengths between 0.4 and 0.7 microns (also called micrometers; 1 micron is 1 millionth of a meter (or a yard)).
Infrared wavelengths are longer than people can see. The thermal infrared radiation that we use to study Yellowstone has wavelengths from about 7.5 to 13 microns, which is 10 times longer than the wavelengths of visible light.
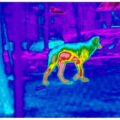
If something is hot enough, like a lava flow, it glows with light we can see with our eyes—this is called incandescence. With practice, you can estimate the temperature of glowing lava just by its color. The surface temperatures of thermal features in Yellowstone are not hot enough to glow with visible light, but they do emit radiation at thermal infrared wavelengths. And although we can’t see thermal infrared radiation with our eyes, we can build instruments, like thermal infrared cameras, that can. These instruments can be mounted on aircraft or satellites and act as extensions of our eyes, allowing us to see the world in a new light (literally) and from different perspectives.
Using Landsat 8 thermal infrared images as an example, let’s go through some basic image interpretation. The first thing you may notice is that these are greyscale images, with pixels that range from very bright to very dark, which in this case indicates differences in surface temperature. You may also notice some recognizable shapes, like lakes, rivers, mountains, valleys, and clouds.
During the day, bodies of water are generally cooler (have darker pixels) than the surrounding land. The opposite is true at night, when lakes and rivers are warmer (brighter) than the land. This is because of differences in the thermal properties of water compared to rocks and soils. Water takes a long time to heat up during the day and it slowly releases its heat overnight. By contrast, rocks and soils heat up more quickly during the day and cool off more quickly at night. Similarly, densely forested areas tend to be a bit warmer than areas with open grasslands or low vegetation, especially at night, and especially when open areas are covered in snow.
In Yellowstone, seasons are also important. Surface temperatures are generally warmer in the summer and colder in the winter—extremely cold in fact, with nighttime temperatures in the winter commonly dipping below -20 °C (-4 °F); the record low is -54 °C (-66 °F)! Although, even in the summer, there can be snow present on high plateaus and mountain peaks. Also, most lakes in Yellowstone freeze in the winter, except the ones that receive warm water from nearby hot springs or underwater vents. Topography (elevation, slope, and aspect) also effects surface temperature, because the nature of the terrain controls the amount of direct sunlight that heats the surface during the day. At night, these effects are minimized, except that lower elevation areas always tend to be warmer (with brighter pixels) than higher elevations because of air movement.
All of these complications mean that when looking at a thermal infrared image, context is very important. Was the image acquired at night or during the day? What is the season? What sort of vegetation is present? What does the landscape or terrain look like? All these factors are critical to properly interpreting a thermal infrared image.
So, what are we looking for when trying to map thermal areas in Yellowstone? Answer: small natural areas (in other words, not parking lots or rooftops) that are significantly warmer than their surroundings, especially at night in the winter. These conditions maximize the contrast between warm, thermal ground or thermally heated lakes versus cool, non-thermal ground or lakes that are frozen in winter. By comparing these types of images over time, we can identify changes—it was this practice that led to the discovery of a new thermal area near Tern Lake in 2019!
Thermal infrared satellite images are an important method of monitoring volcanoes because of their good resolution and ability to recognize subtle thermal features on the landscape. But as with most things, context is key! And by understanding context, we can tune our eyes in the sky to detect changes at Yellowstone and other volcanic areas around the world that might otherwise go unnoticed.
[ad_2]
Source link

- Warmer water could cool Montana’s trout fishing economy - September 7, 2022
- Water Released from Crystallizing Magma can Trigger Earthquakes in Yellowstone - September 5, 2022
- Thermal Infrared Remote Sensing at Yellowstone 101 - August 29, 2022